


If you manage projects, you’ve probably faced this question: “Are we really on track, or does it just feel that way?” Earned Value Management answers that question with numbers, not guesswork. It’s one of the most trusted techniques in project management, and construction companies, IT teams, and government contractors use it every day to keep budgets and schedules under control.
This guide breaks down EVM in simple terms, explains why it matters, and walks through a real-world example of a commercial building project in Sambhal, Uttar Pradesh.
What Is Earned Value Management?
Earned Value Management is a project performance measurement technique. It combines three things – scope, schedule, and cost – into one integrated system. Instead of tracking money spent and time passed separately, EVM merges them so you can see the true health of your project at a glance.
Traditional tracking methods often mislead project managers. A project can look fine on paper because the money is being spent as planned, but the actual work completed might be far behind. EVM fixes this blind spot by measuring the value of work actually performed, not just the money that has gone out the door.
What Is Earned Value Analysis?
Earned Value Analysis (EVA) is the process of using EVM data to actually evaluate performance. In simple terms, EVM is the system, and Earned Value Analysis is the act of applying that system to a live project.
Earned Value Analysis takes the three core numbers – Planned Value, Earned Value, and Actual Cost – and turns them into meaningful insights. It answers practical questions like:
- Is the project ahead of or behind schedule right now?
- Is the project spending more or less money than the value of work completed?
- Based on current performance, what will the project actually cost at completion?
- When will the project realistically finish?
Project managers perform Earned Value Analysis at regular intervals – weekly or monthly – rather than only at the end. This turns EVM from a one-time report into an ongoing health check that catches problems while there’s still time to correct them.
Fundamental Terms of EVM
Before using EVM, it helps to know its basic vocabulary. These terms show up in every calculation and report.
- Planned Value (PV): — The authorized budget assigned to scheduled work. It represents what should have been spent by a certain point in time.
- Earned Value (EV): — The value of work actually completed, expressed in terms of the approved budget for that work.
- Actual Cost (AC): — The real cost incurred to accomplish the work completed so far.
- Budget at Completion (BAC): — The total approved budget for the entire project, from start to finish.
- Cost Variance (CV): — The difference between earned value and actual cost. It shows whether the project is under or over budget.
- Schedule Variance (SV): — The difference between earned value and planned value. It shows whether the project is ahead of or behind schedule.
- Cost Performance Index (CPI): — The ratio of earned value to actual cost. It measures how efficiently the budget is being used.
- Schedule Performance Index (SPI): — The ratio of earned value to planned value. It measures how efficiently the schedule is being used.
- Estimate at Completion (EAC): — A forecast of the total cost of the project once it is complete, based on current performance trends.
- Estimate to Complete (ETC): — The expected cost required to finish all the remaining work.
- Variance at Completion (VAC): — The projected difference between the budgeted cost and the estimated final cost.
Once these terms feel familiar, the formulas built from them become much easier to understand.
Why Is EVM Used?
Project managers use EVM because it answers three critical questions at any point in the project:
- Are we ahead or behind schedule?
- Are we spending more or less than planned?
- Will we finish within budget?
EVM gives an early warning system. It flags problems weeks or months before they become disasters. A project manager who waits until the final report to discover a cost overrun has already lost the chance to fix it. EVM catches these issues early, while there’s still time to act.
It’s also widely required in government and defense contracts, large infrastructure projects, and enterprise-level programs, because it brings objectivity to progress reporting. Stakeholders don’t have to rely on a project manager’s opinion – they get hard numbers.
Key Benefits of EVM
- Early problem detection: Cost and schedule issues surface long before the project deadline.
- Objective progress tracking: Progress is measured with data, not subjective status updates.
- Better forecasting: EVM lets you predict the final project cost and completion date based on current performance.
- Improved accountability: Teams and contractors can be evaluated on measurable performance, not impressions.
- Stronger stakeholder confidence: Clients and sponsors trust numbers backed by a proven methodology.
- Informed decision-making: Managers can make corrective decisions, like reallocating resources, based on real trends.
Key Components of EVM
To understand EVM, you need to know its foundational terms. These form the backbone of every calculation.
- Planned Value (PV): The budgeted cost of work that was scheduled to be completed by a specific date. Think of it as “what we expected to spend by now.”
- Earned Value (EV): The budgeted cost of work actually completed by that date. This is “what the completed work is actually worth.”
- Actual Cost (AC): The real money spent to complete the work so far.
- Budget at Completion (BAC): The total approved budget for the entire project.
From these four building blocks, EVM derives several performance indicators:
- Cost Variance (CV) = EV − AC. Tells you whether you’re under or over budget.
- Schedule Variance (SV) = EV − PV. Tells you whether you’re ahead or behind schedule.
- Cost Performance Index (CPI) = EV / AC. Measures cost efficiency. A CPI above 1.0 means you’re spending less than planned for the work done.
- Schedule Performance Index (SPI) = EV / PV. Measures schedule efficiency. An SPI above 1.0 means you’re ahead of schedule.
- Estimate at Completion (EAC). A forecast of the total project cost based on current performance.
- Estimate to Complete (ETC). The expected cost to finish the remaining work.
- Variance at Completion (VAC) = BAC − EAC. Shows the projected budget surplus or deficit at project end.
These formulas sound technical, but once you plug in real numbers, they become intuitive fast.
The S-Curve: Visualizing EVM Over Time
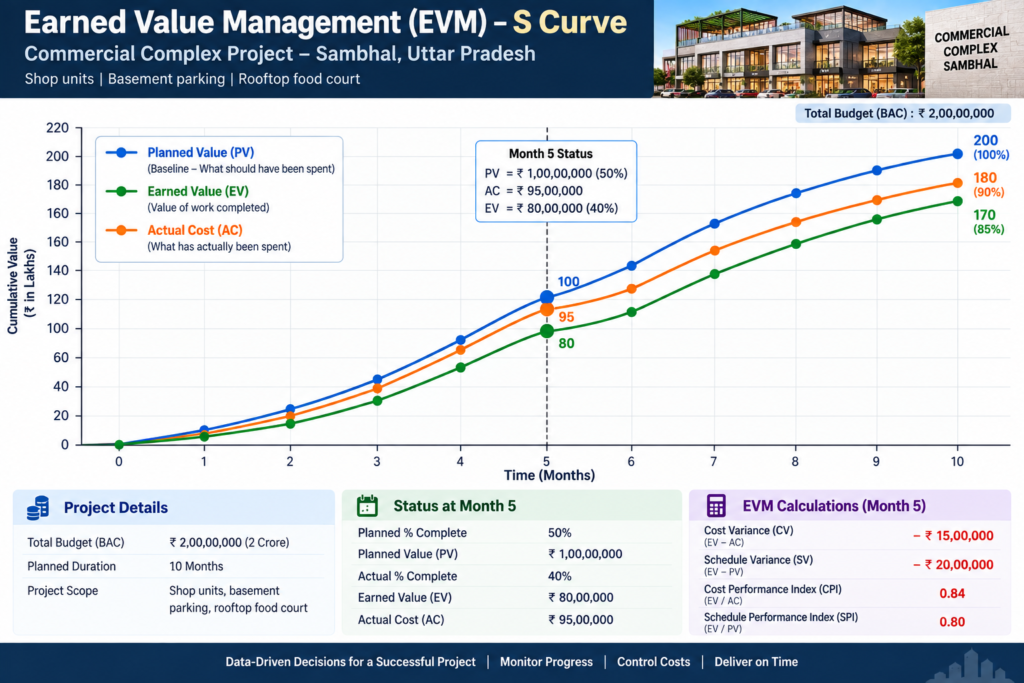
An S-Curve is a graph that plots cumulative project values, such as Planned Value, Earned Value, and Actual Cost, against time. It’s called an S-Curve because project spending naturally follows an S-shaped pattern: slow at the start, faster during the main execution phase, and slow again near completion.
On an EVM S-Curve, you typically see three lines plotted together:
- PV Curve (Baseline): A smooth, steadily rising curve showing what should have been spent over time, based on the baseline schedule.
- EV Curve (Performance): A curve showing the actual value of work completed over time. When this line falls below the PV curve, the project is behind schedule.
- AC Curve (Actual Cost): A curve showing real money spent over time. When this line rises above the EV curve, the project is spending more than the work is worth.
The S-Curve is one of the most useful visual tools in EVM because it lets anyone, even someone without a project management background, immediately see project health. If the EV line drifts below the PV line, the project is falling behind. If the AC line climbs above the EV line, costs are running ahead of progress. Project managers use these visual gaps to explain project status to clients and stakeholders in seconds, without needing to walk through detailed calculations.
Many project managers update the S-Curve weekly or monthly, so trends become visible early. A single data point tells you very little, but a curve trending in the wrong direction over several weeks is a clear signal to intervene.
Real-World Example: A Commercial Building Project in Sambhal

Imagine a developer is constructing a small commercial complex in Sambhal, Uttar Pradesh. The project involves shop units, a basement parking area, and a rooftop food court space. Here’s how EVM would apply.
Project Setup
- Total budget (BAC): ₹2,00,00,000 (2 crore)
- Planned duration: 10 months
- Baseline assumption: At the 5-month mark, the plan assumed 50% of the work would be done, meaning PV = ₹1,00,00,000
Actual Status at Month 5
- Work completed: The contractor has completed the foundation, structural framing, and half the brickwork, which the project team values at 40% of total scope. So EV = ₹80,00,000.
- Money spent: The actual money spent so far is ₹95,00,000. So AC = ₹95,00,000.
The Calculations
Cost Variance (CV) = EV − AC = 80,00,000 − 95,00,000 = −₹15,00,000
This is negative, meaning the project is over budget. The work completed is worth less than what was actually spent on it.
Schedule Variance (SV) = EV − PV = 80,00,000 − 1,00,00,000 = −₹20,00,000
This is also negative, meaning the project is behind schedule.
Cost Performance Index (CPI) = EV / AC = 80,00,000 / 95,00,000 = 0.84
A CPI below 1.0 confirms poor cost efficiency. For every rupee spent, the project is only getting back 0.84 rupees of value.
Schedule Performance Index (SPI) = EV / PV = 80,00,000 / 1,00,00,000 = 0.80
An SPI of 0.80 confirms the project is running behind. Only 80% of the planned work has actually happened.
What This Tells the Developer
The numbers paint a clear picture. Material costs may have risen unexpectedly, labor productivity may be low, or there could be delays from monsoon weather or material shortages common in the region. Whatever the cause, the developer now has hard evidence to act on – renegotiating supplier rates, adding a second labor shift, or revising the project timeline before the delay grows worse.
Using the Estimate at Completion (EAC) formula, the team can also forecast that if this cost trend continues, the final project cost could rise well above the original ₹2 crore budget – giving the developer time to secure additional financing or cut costs elsewhere before it becomes a crisis.
If this developer were plotting an S-Curve for the project, the AC line would already be sitting above the EV line, and the EV line would be trailing below the PV line. That visual gap alone would tell the story before any formula is even calculated.
Final Thoughts
Earned Value Management turns vague progress updates into precise, actionable data. Whether you’re building a commercial complex in Sambhal, managing a software rollout, or running a government infrastructure project, EVM gives you an honest picture of where your project actually stands, not where you hope it stands.
Start simple: track your PV, EV, and AC consistently, plot them on an S-Curve, and the rest of the formulas will follow naturally. Once teams get comfortable with EVM, it becomes second nature, and a powerful tool for delivering projects on time and on budget.